In this tutorial, I am going to write about how to calculate the Mean, Median, and Mode in Google Sheets.
Something that you learn in statistics is the central tendency which is a value that identifies the central position in a dataset.
The three primary measures of central tendency are the mean, median, and mode.
How to Calculate the Mean, Median, and Mode in Google Sheets
- Prepare the range that will be used as a reference
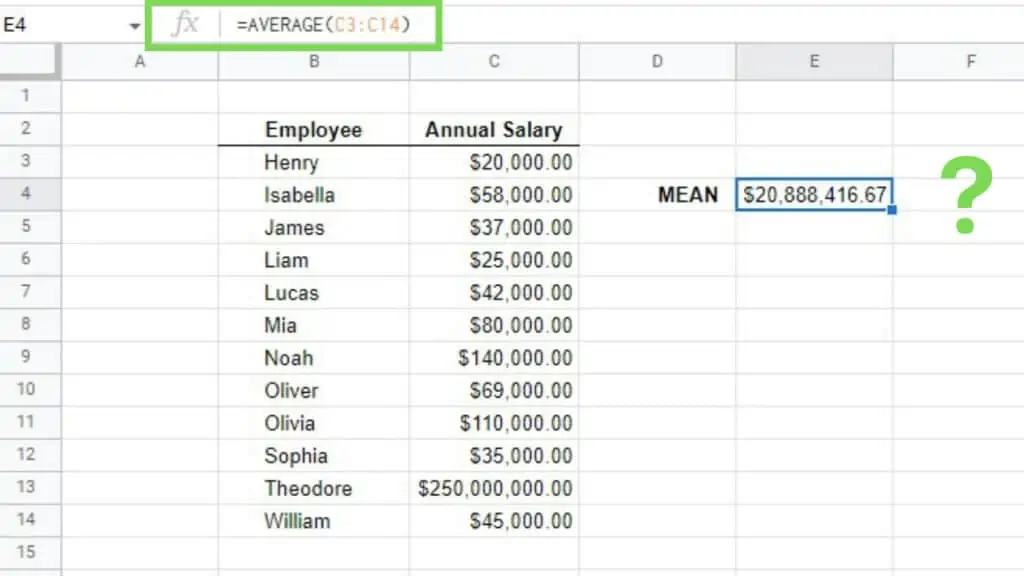
- To calculate the mean, use the formula: “=AVERAGE(value1, [value2, …])”
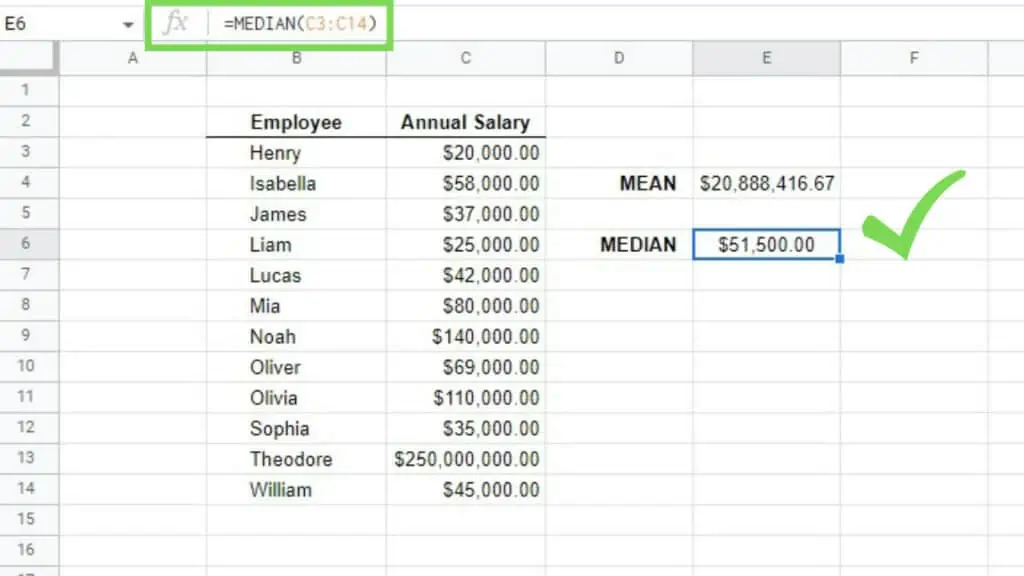
- To calculate the median, use the formula: “=MEDIAN(value1, [value2, …])”
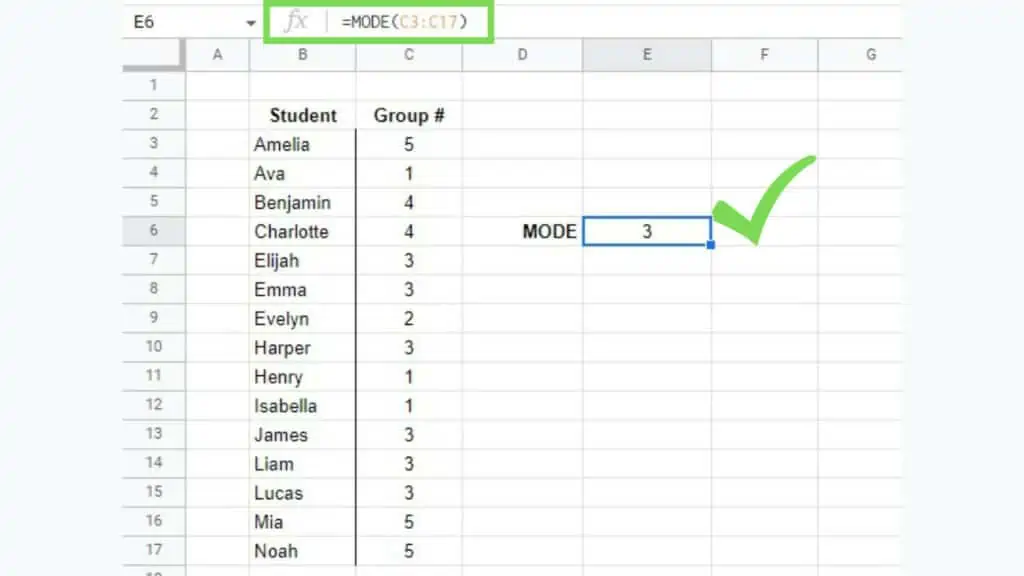
- To calculate the mode, use the formula: “=MODE(value1, [value2, …])”

Video Tutorial about calculating the Mean, Median, and Mode in Google Sheets
Formulas to Calculate the Mean, Median, and Mode in Google Sheets
Before I begin, let’s have a look at the following definitions:
- Mean: calculated by adding all values in a dataset divided by the number of values in the dataset.
- Median: the middle value of a dataset arranged by increasing order.
- Mode: most common value in a dataset
Before we start to calculate the mean, median, and mode in Google Sheets we must have the reference range prepared.
Formula to Calculate the Mean
Also known as the arithmetic mean or the average, MEAN doesn’t have a direct function in Google Sheets. Instead, it is represented by its other name, AVERAGE.
The syntax of the AVERAGE Function is:
=AVERAGE(value1, [value2, …])
In the example below, I used the AVERAGE Function to calculate the mean in terms of dates and per item.
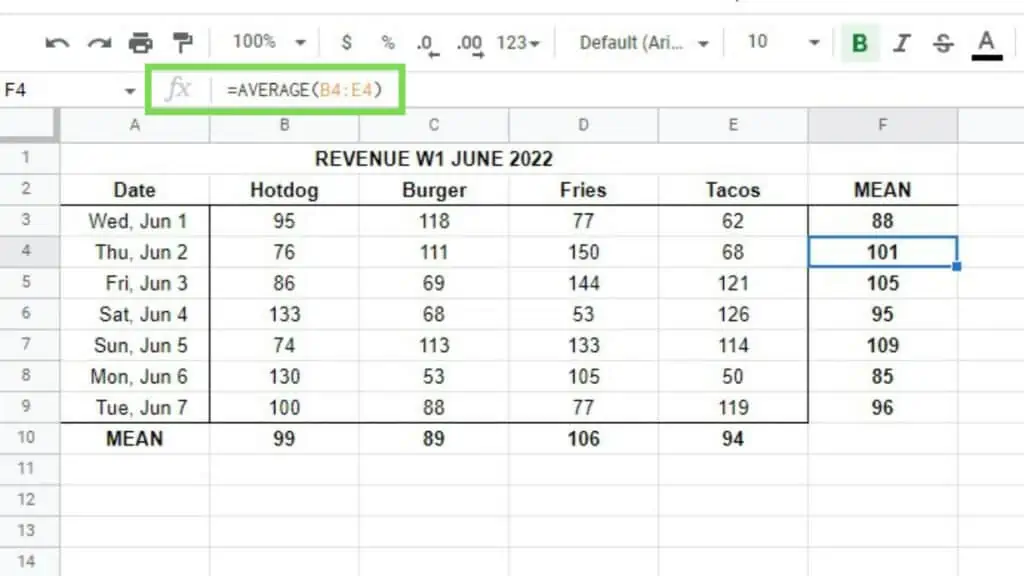
The AVERAGE Function does not include text. This means that including the header of a dataset table that you are using as a reference will not cause the function to incorrectly change the result.
Formula to Calculate the Median
The Median is all about getting the middle-most value in a dataset.
The syntax of the MEDIAN Function:
=MEDIAN(value1, [value2, …])
The next example is a dataset of employees and their respective annual salaries. I calculated the mean for this list, you can see that it is different from the rest of the data because of a single outlier which is “Theodore”.
In a list of salaries mostly consisting of 5-digit payouts, an 8-digit payout can never represent said database.
This is where the median works best. This works with datasets highly askew by a few outliers.
You can compare the results of the mean vs the median for this dataset below.
The MEDIAN Function does not include text. This means that including the header of a dataset table that you are using as a reference will not cause the function to incorrectly change the result.
Formula to Calculate the Mode
The Mean is also referred to as the Average, while the Median is known as the middle-most value in a dataset. Mode on the other hand is more about identifying the most frequent value in a dataset.
The syntax of the MODE Function:
=MODE(value1, [value2, …])
In the example below, I have a dataset of student names and their respective group numbers regarding a project.
Using the MODE Function here allowed me to identify that group #3 has the most members at this time. And knowing this information gives me better decision-making capabilities like for example, I should not assign more students to group #3 as it’s already the most populated group at this time.
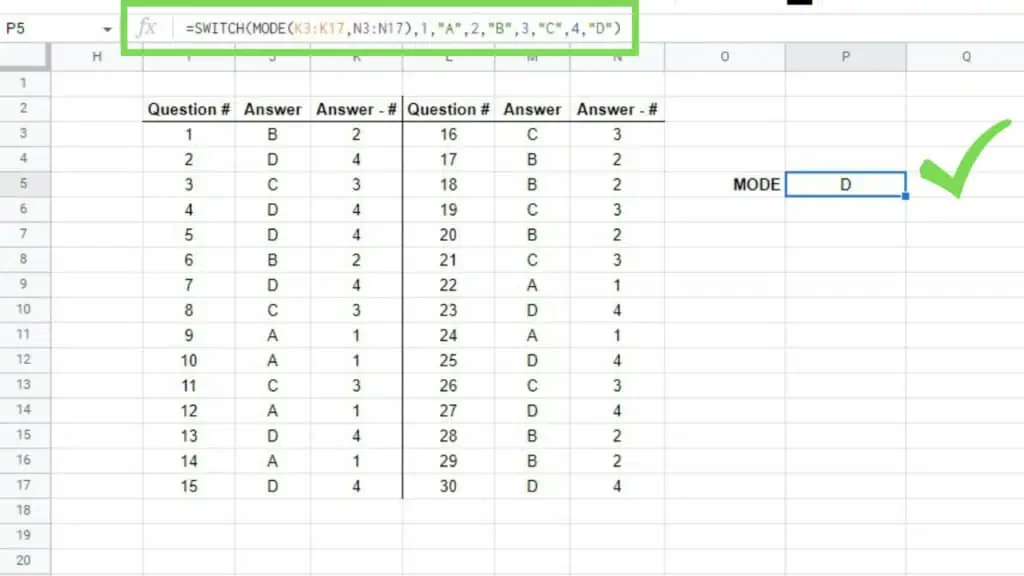
Mode is also great in knowing which answer in a multiple-choice exam comes up the most often.
This can prevent students to assume that you have a bias in terms of assigning the correct answer to choices.
That said, since multiple choices are often labeled with A-B-C-D, the MODE Function won’t work. This is because it ignores text and letters in general.
To circumvent this, I used the SWITCH Function below and assigned a number to each letter. And now, since each answer is now assigned a number, I can now use the MODE Function.
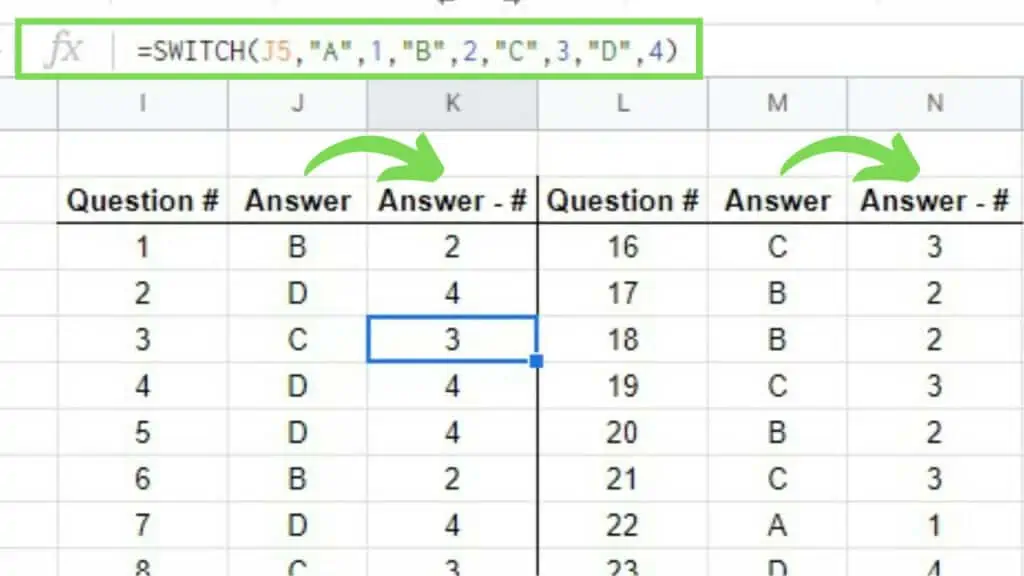
In the formula that I used below, I used MODE on columns K and N where the “switched” numbers are.
This defined “4” to be the most frequent answer and in turn, “D”. To show the right value which is “D”, I used the SWITCH Function again to “switch back” the answers.
The MODE Function does not include text. This means that including the header of a dataset table that you are using as a reference will not cause the function to incorrectly change the result.
This is also the main reason why we use the SWITCH Function.
These are the different ways to calculate the mean, median, and mode in Google Sheets. Once you master analyzing your data, it will soon be time to know how to present your data best.
Consider Pie Charts and Line Graphs to help you visualize your data.
Frequently Asked Questions about How to Calculate the Mean, Median, and Mode in Google Sheets
How can I calculate a mean in Google Sheets where texts are included but counted as zero?
To calculate a mean in Google Sheets where texts are included but counted as zero, use the AVERAGEA Function instead of AVERAGE.
Is there an alternative to the AVERAGE Function to calculate the Mean in Google Sheets?
AVERAGE returns the mean of the values in your dataset which is the sum of the values in the value arguments divided by the number of such values. Basically, you can rewrite it as “=SUM(range)/COUNT(range)”.
Conclusion on How to Calculate the Mean, Median, and Mode in Google Sheets
To calculate the Mean, Median, and Mode in Google Sheets, prepare the range that will be used as a reference first.
For Median use the formula: “=AVERAGE(value1, [value2, …])” while
For median, use the formula: “=MEDIAN(value1, [value2, …])”.
For mode, use the formula: “=MODE(value1, [value2, …])”.