Error bars in Google Sheets are a way to account for cases where values are not 100% certain and could deviate.
Google Sheets has a way to account for such cases by adding error bars in charts.
But how to insert error bars in Google Sheets and in what cases would I need them?
As an example, a Head of Sales might have to project the sales for a whole year. He will look at the best and worst-case as well as the most realistic case. In Google Sheets, he will create a chart that forecasts these sales for each month. The estimated sales might be more within a range than an exact number.
In such an example, error bars in Google Sheets can be used to account for uncertainty and display it as an add-on to a chart.
I personally use this feature quite often and would like to show you in this tutorial how you can add error bars in your Google Sheets charts.
How to Insert Error Bars in Google Sheets
To insert error bars in Google Sheets follow these steps:
- Create a new chart by selecting the columns you want to convert to a chart
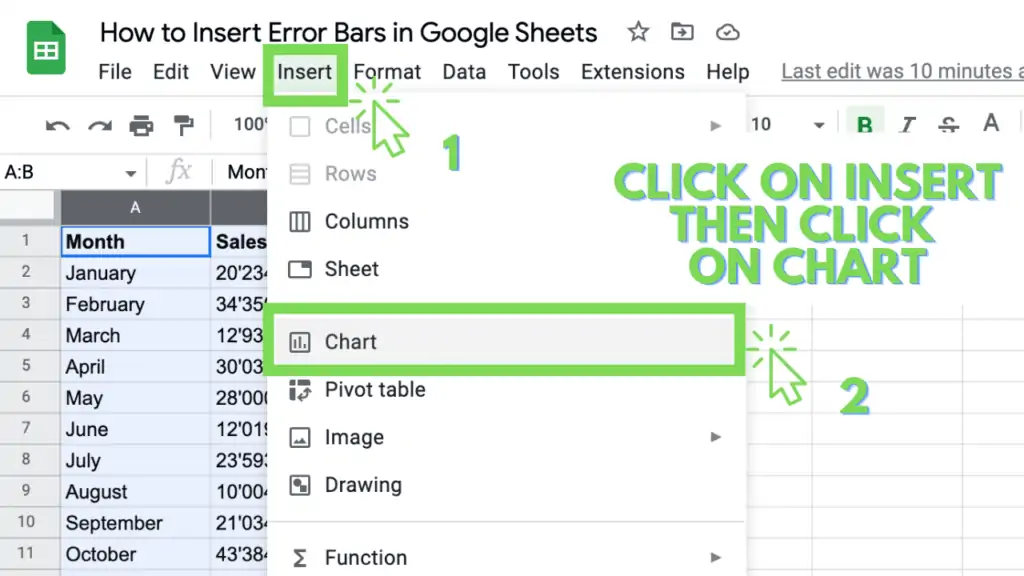
- In the main menu go on “Insert” and select “Chart”
- The “Chart menu” appears
- Click on “Customize“
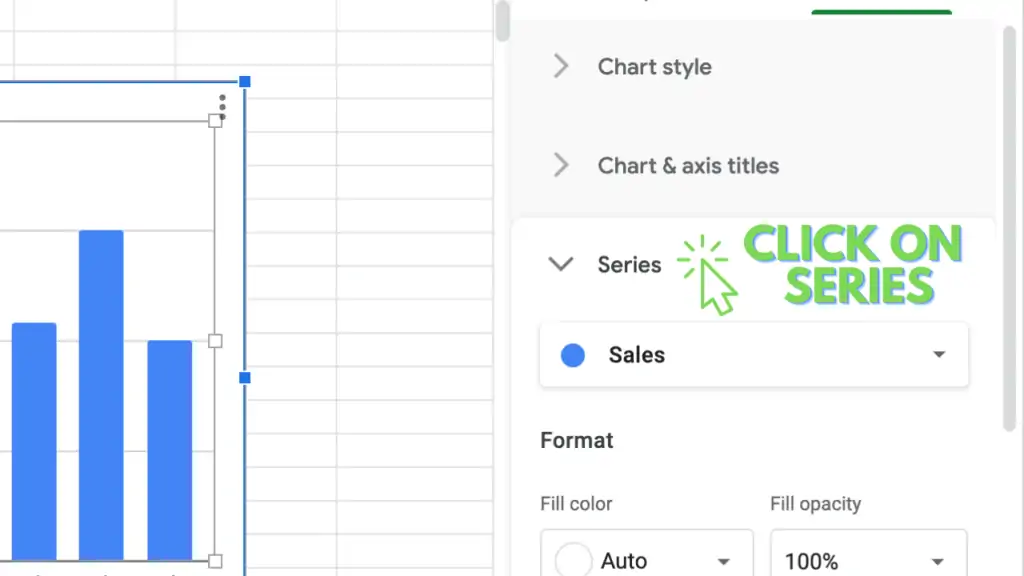
- Then choose “Series“
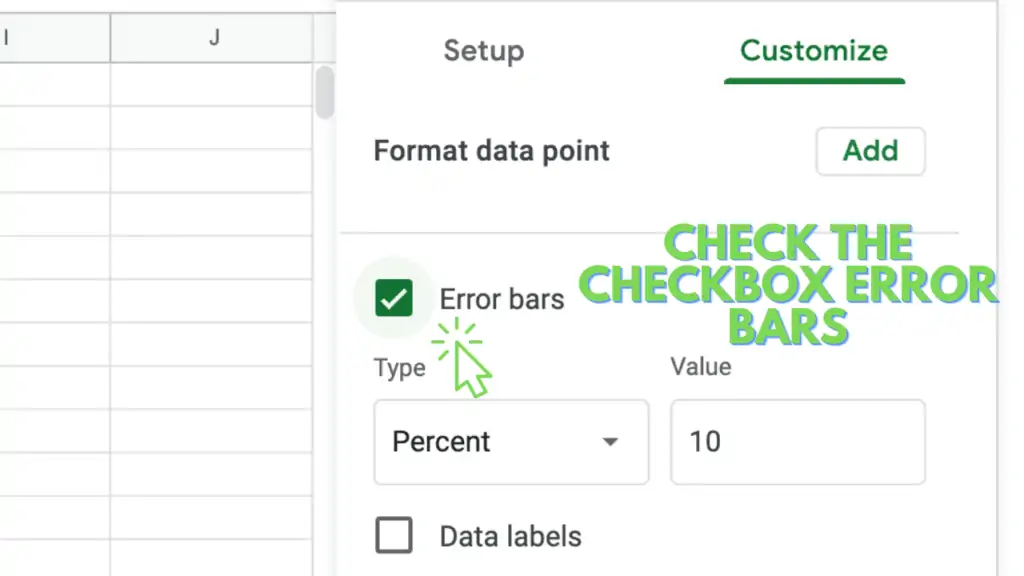
- Within Series check the checkbox “Error Bars”
- Choose from the available types “Constant”, “Percent”, and “Standard Deviation”
How to Insert Error Bars in Google Sheets Video Tutorial
How to Insert Error Bars in Google Sheets – Step-By-Step
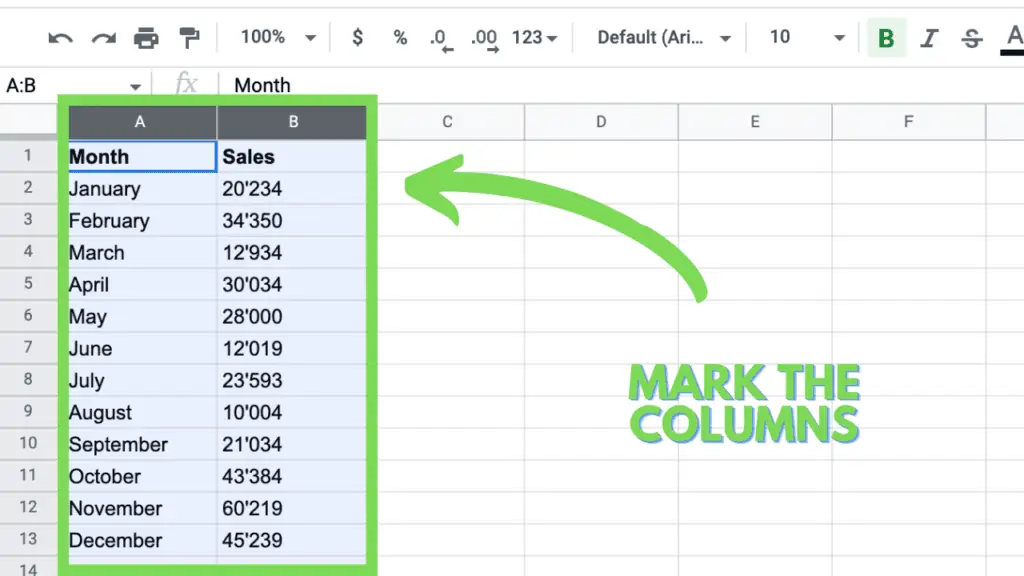
Step 1 – Create a new chart by creating and selecting the columns you want to convert to a chart
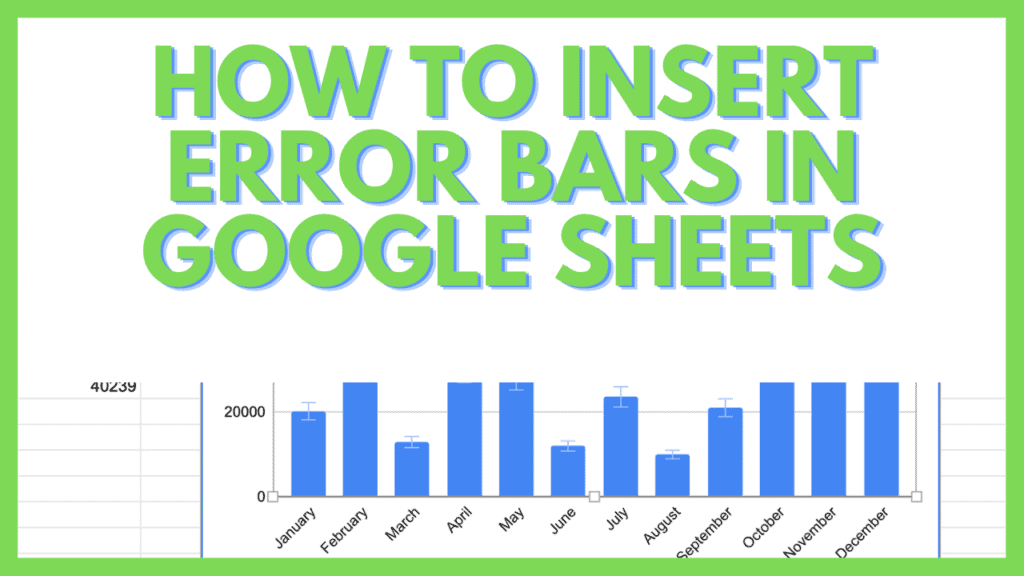
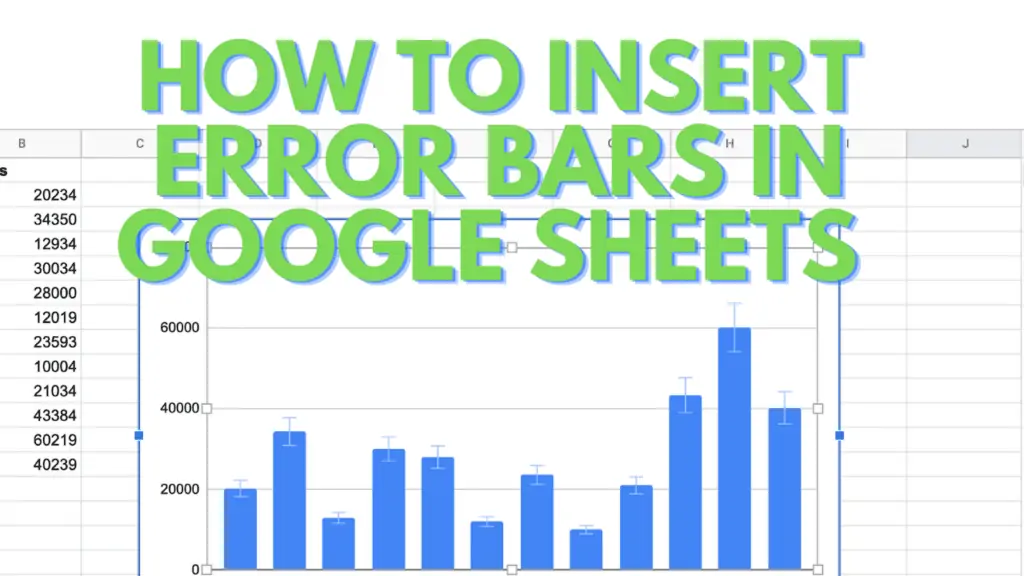
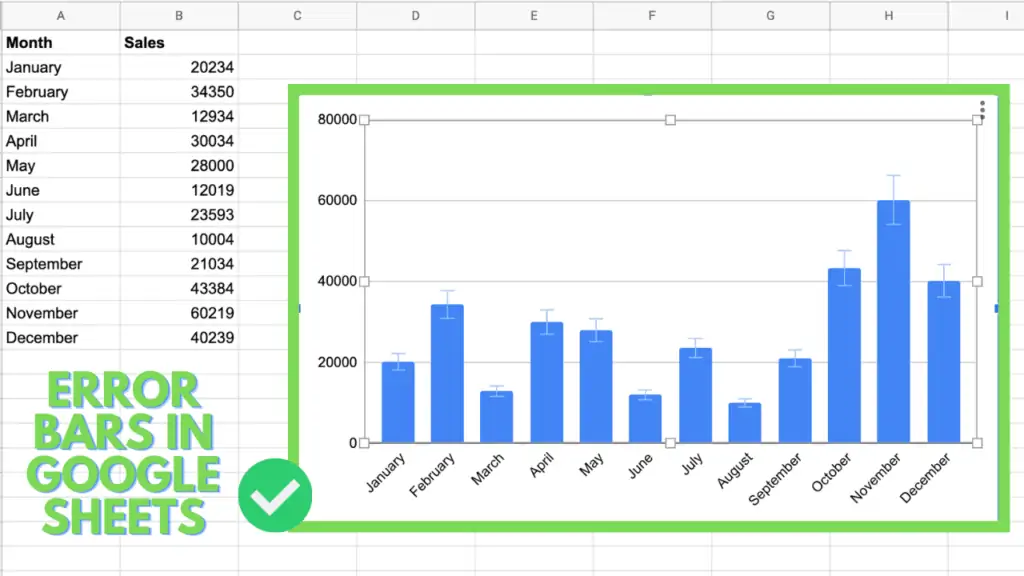
In my example, I created two columns to represent the different months of the year as well as the estimated sales revenue for each month.
Step 2 – In the main menu go on “Insert” and select “Chart”
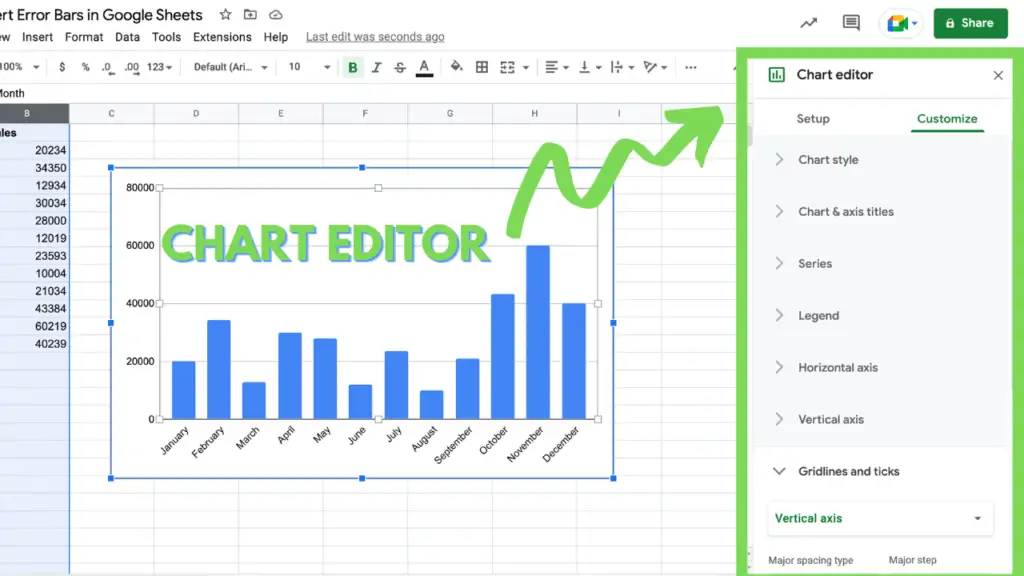
Step 3 – The chart editor appears on the right-hand side
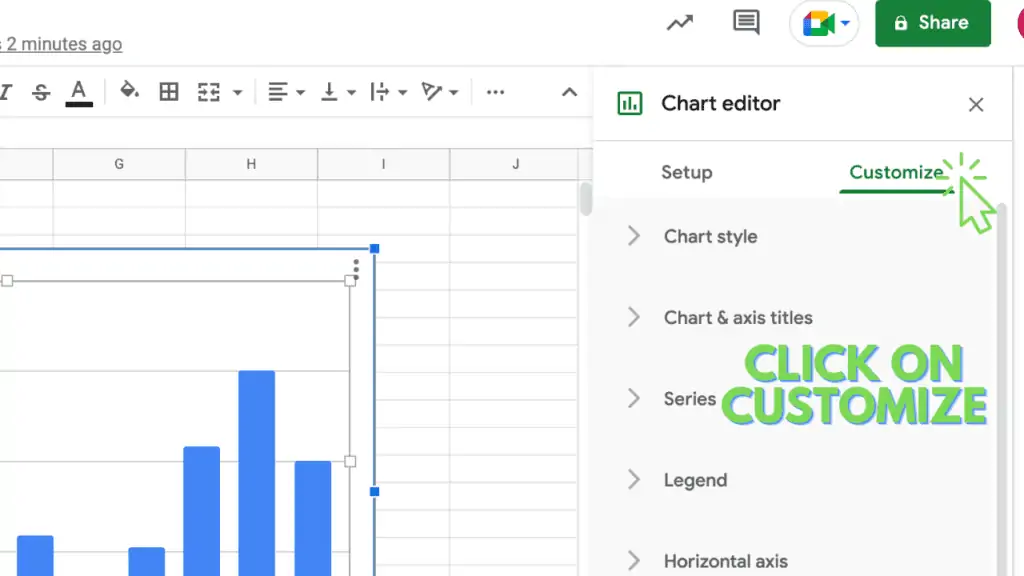
Step 4 – Click on “Customize”
Step 5 – Then click on “Series”
Step 6 – Within Series check the checkbox “Error Bars”
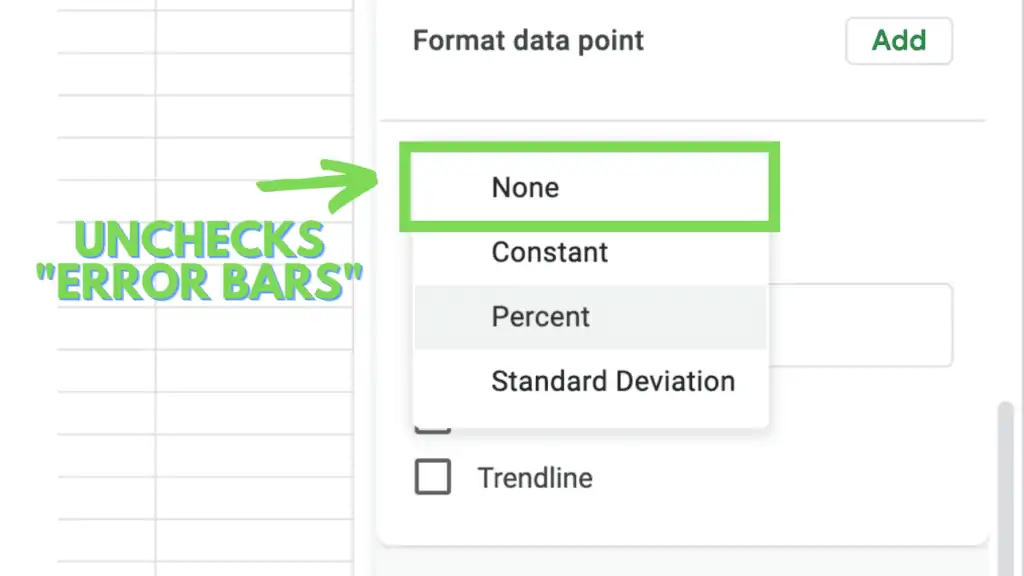
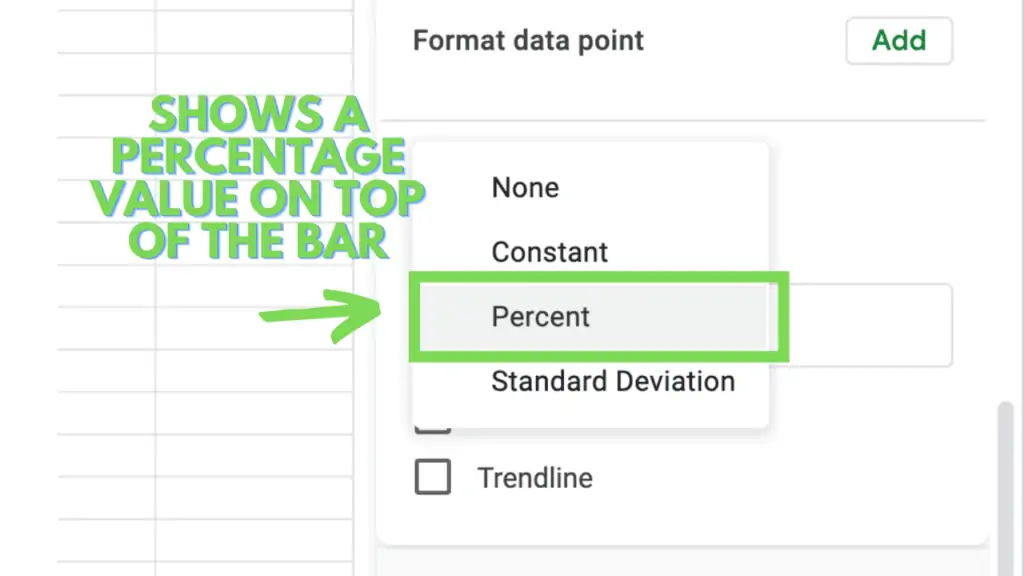
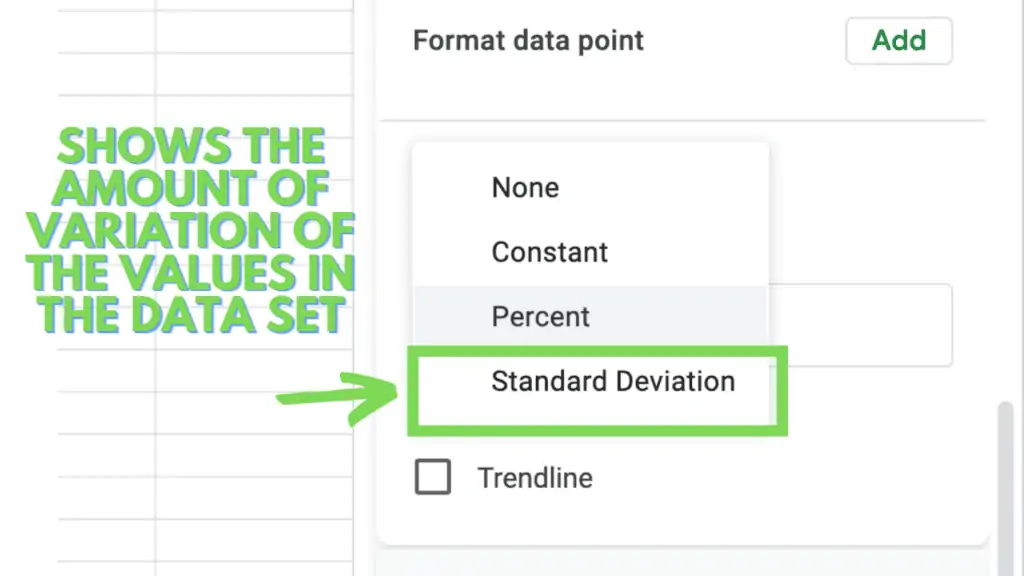
Step 7 – Choose from the available types “Constant”, “Percent”, and “Standard Deviation”
Available error bars options:
- “None”: This option will simply uncheck the checkmark and won’t display an error bar
- “Constant”: This will show a fixed value. If you eg. enter the value “10’000”. It will show an error bar of +10’000 and -10’000 on top of each bar.
- “Percent”: Show the error bars as percentage values of the respective totals
- “Standard Deviation”: Standard deviation shows the amount of variation of a set of values in the data set
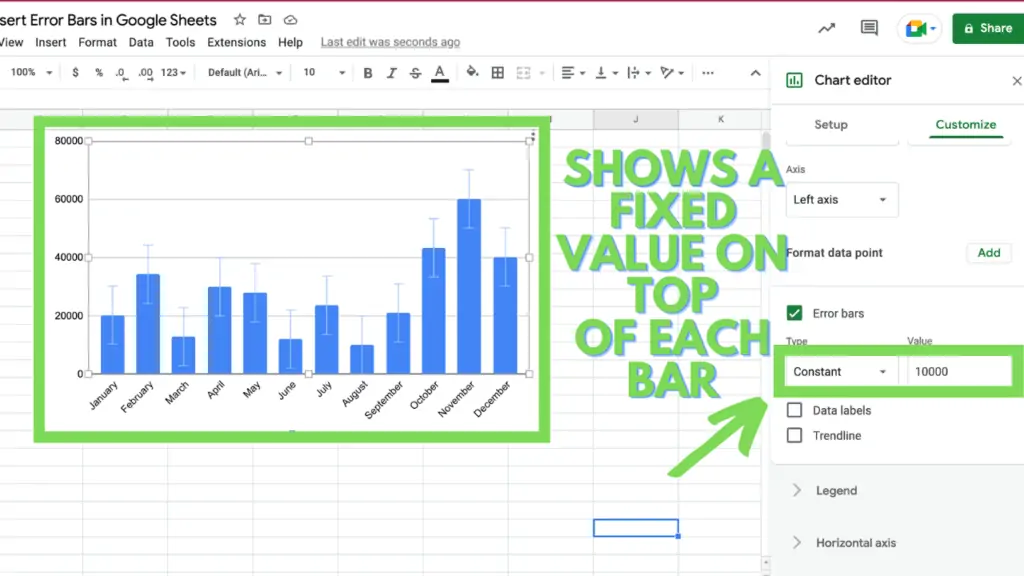
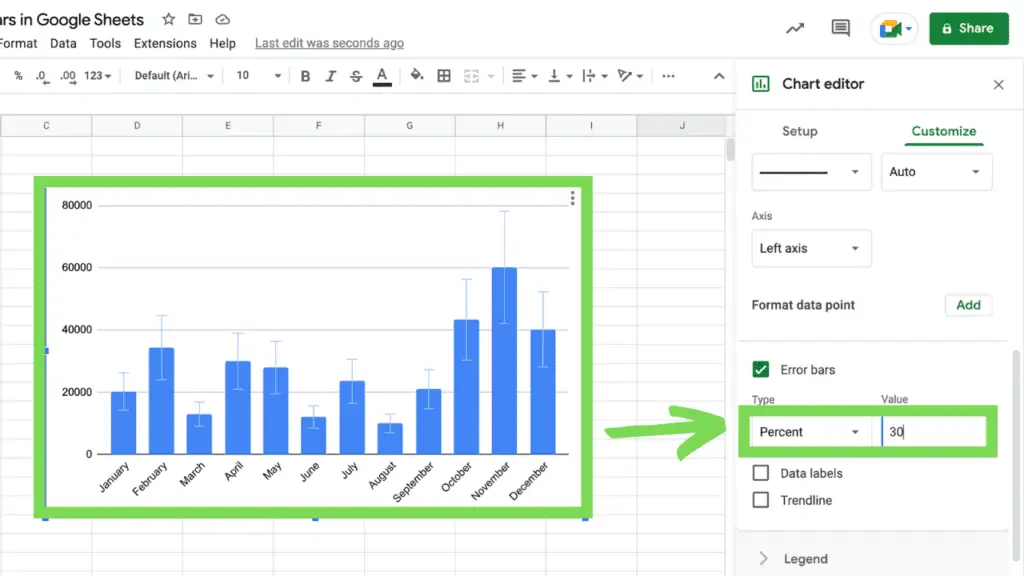
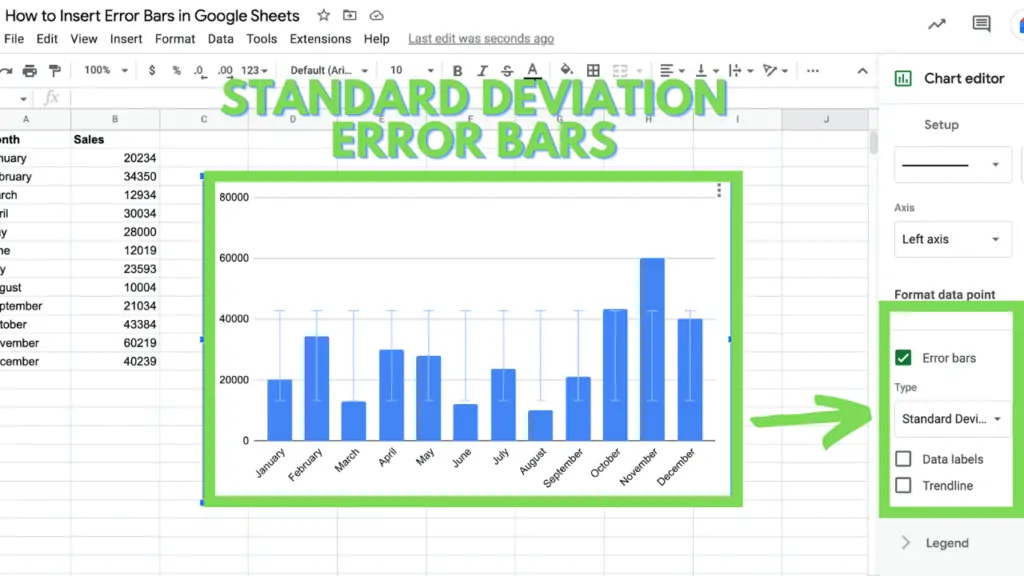
Step 8 – After selecting one of the Error bar types you will see the error bars right on your chart in Google Sheets.
Conclusion On How To Insert Error Bars in Google Sheets
To insert error bars in Google Sheets use the “Chart Menu” and go to “Customize”. Then select the option “Series” and check the checkmark “Error Bars”. There are 3 different error bar types to choose from “Constant”, “Percent” and “Standard Deviation”. “None” will unmark the error bar option.